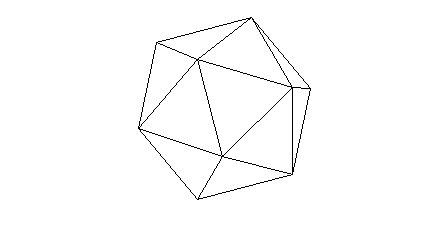
plot DATA {using 1:2} with polygons
plot with polygons は、現在は plot with filledcurves closed として 処理されます。各多角形には、3 列目の値を与え、キーワード lc variable を指定する (その値を linetype と解釈) か、lc rgb variable を指定する (その値を 24 ビット RGB 色と解釈) ことで、個別の色を割り当てることがで きます。多角形の最初の頂点の色の値のみが使用されます。境界の線種は、も しあれば塗り潰しスタイル (fill style) から取ります。
3 次元グラフ:
    splot DATA {using x:y:z} with polygons
          {fillstyle <fillstyle spec>}
          {fillcolor <colorspec>}

    set xyplane at 0
    set view equal xyz
    unset border
    unset tics
    set pm3d depth
    set pm3d border lc "black" lw 1.5
    splot 'icosahedron.dat' with polygons \
          fs transparent solid 0.8 fc bgnd