各点毎に、そして事前に、設定する属性の多くの組み合わせ指定が可能です。 2 次元描画では、以下が指定できます。
   using x:y
   using x:y:radius
   using x:y:color
   using x:y:radius:color
   using x:y:radius:arc_begin:arc_end
   using x:y:radius:arc_begin:arc_end:color
デフォルトでは完全な円を描画しますが、4 列目、5 列目に開始角と終了角 (単位は度)を指定することで円弧の一部を描画することもできます。
using 指定の最後の列で、円毎の色も指定できます。この場合、plot コマン ドには lc variable か fillcolor rgb variable のような変動色指定を 入れる必要があります。
3 次元描画では、using 指定には以下のものが必要です。
splot DATA using x:y:z:radius:color
変動色の列はオプション (省略可) です。
以下参照: set style circle (p. ![[*]](crossref.png) ), set style fill (p. )。
), set style fill (p. )。
例:
# 面積が 3 列目の値に比例するような円を描画
set style fill transparent solid 0.2 noborder
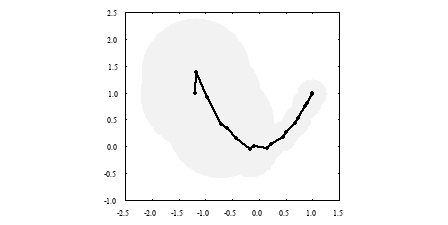
plot 'data' using 1:2:(sqrt($3)) with circles, \
'data' using 1:2 with linespoints
   # 円の代わりにパックマンを描画
   plot 'data' using 1:2:(10):(40):(320) with circles
   # インランデータで円グラフを描画
   set xrange [-15:15]
   set style fill transparent solid 0.9 noborder
   plot '-' using 1:2:3:4:5:6 with circles lc var
   0    0    5    0    30    1
   0    0    5   30    70    2
   0    0    5   70   120    3
   0    0    5  120   230    4
   0    0    5  230   360    5
   e
これは、pointstyle 7 で点のサイズを variable とした points による描
画と似ていますが、circles は x 軸の範囲で伸縮される点が異なります。以下も参照: set object circle (p. ), fillstyle (p. )。