
デフォルトでは完全な円を描画しますが、4 列目、5 列目に開始角、終了角を 指定することで扇形を描画することもできます。4 列目、あるいは 6 列目の データを追加して部分円の色を指定することもできます。扇形の開始角、終了 角の単位は度で指定する必要があります。以下参照: set style circle (88.74.8),set style fill (88.74.4)。
例:
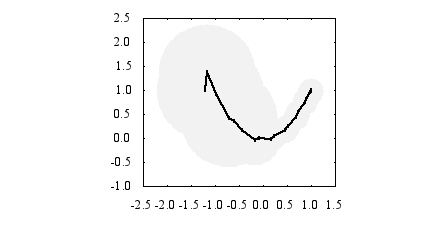
   # 面積が 3 列目の値に比例するような円を描画
   set style fill transparent solid 0.2 noborder
   plot 'data' using 1:2:(sqrt($3)) with circles, \
        'data' using 1:2 with linespoints
   # 円の代わりにパックマンを描画
   plot 'data' using 1:2:(10):(40):(320) with circles
   # インランデータで円グラフを描画
   set xrange [-15:15]
   set style fill transparent solid 0.9 noborder
   plot '-' using 1:2:3:4:5:6 with circles lc var
   0    0    5    0    30    1
   0    0    5   30    70    2
   0    0    5   70   120    3
   0    0    5  120   230    4
   0    0    5  230   360    5
   e
これは、pointstyle 7 で点のサイズを variable とした points による描 画と似ていますが、circles は x 軸の範囲で伸縮される点が異なります。以下も参照: set object circle (88.54.3), fillstyle (88.74.4)。
竹野茂治@新潟工科大学